Lab 12 mnjk: Difference between revisions
NateHaleen (talk | contribs) |
|||
| (10 intermediate revisions by 3 users not shown) | |||
| Line 7: | Line 7: | ||
* Monitor services with [https://www.zabbix.com/ zabbix] | * Monitor services with [https://www.zabbix.com/ zabbix] | ||
You will | You will be introduced to the following commands: | ||
*'''[https://linux.die.net/man/8/netstat netstat]''' | *'''[https://linux.die.net/man/8/netstat netstat]''' | ||
*'''[https://linux.die.net/man/1/ps ps]''' | *'''[https://linux.die.net/man/1/ps ps]''' | ||
*'''[https://linux.die.net/man/1/grep grep]''' | *'''[https://linux.die.net/man/1/grep grep]''' | ||
*'''[https://linux.die.net/man/1/nmap namp]''' | *'''[https://linux.die.net/man/1/nmap namp]''' | ||
=Lab Procedure= | =Lab Procedure= | ||
| Line 52: | Line 50: | ||
'''''[https://www.youtube.com/watch?v=fF5NNRJwLjg Video Tutorial - Monitoring with Zabbix]''''' <br> | '''''[https://www.youtube.com/watch?v=fF5NNRJwLjg Video Tutorial - Monitoring with Zabbix]''''' <br> | ||
In this section we will be following the instruction on how to install zabbix using [https://www.zabbix.com/download?zabbix=5.0&os_distribution=debian&os_version=10_buster&db=mysql&ws=apache these instructions on the Zabbix site]. | In this section we will be following the instruction on how to install zabbix using [https://www.zabbix.com/download?zabbix=5.0&os_distribution=debian&os_version=10_buster&db=mysql&ws=apache these instructions on the Zabbix site]. | ||
<ol> | <ol> | ||
<li> Go to the instructions link above and scroll down to part 2. Start by installing the zabbix repository.</li> | <li> Go to the instructions link above and scroll down to '''part 2'''. Start by installing the zabbix repository.</li> | ||
<code>wget https://repo.zabbix.com/zabbix/5.0/debian/pool/main/z/zabbix-release/zabbix-release_5.0-1+buster_all.deb</code><br> | <code>wget https://repo.zabbix.com/zabbix/5.0/debian/pool/main/z/zabbix-release/zabbix-release_5.0-1+buster_all.deb</code><br> | ||
<code>dpkg -i zabbix-release_5.0-1+buster_all.deb</code><br> | <code>dpkg -i zabbix-release_5.0-1+buster_all.deb</code><br> | ||
<code>apt update</code> | <code>apt update</code> | ||
<li>Install Zabbix server, frontend, agent</li> | |||
<code>apt install zabbix-server-mysql zabbix-frontend-php zabbix-agent</code> | |||
<li>Create a database, a user, and schema following the instructions on the same website. | <li>Create a database, a user, and schema following the instructions on the same website. | ||
: ''NOTE: These instructions use the MySQL/MariaDB command line, if you prefer you can create the same database, user, and schema using the Webmin software but you'll have to translate the command line instructions into the actions required in Webmin.'' | |||
<code>mysql -uroot -p</code><br> | |||
<code>create database zabbix character set utf8 collate utf8_bin;</code><br> | |||
<code>create user zabbix@localhost identified by 'password';</code><br> | |||
* Replace password with a password you want to use. (Command needs the quotes so don't remove them). | |||
<code>grant all privileges on zabbix.* to zabbix@localhost;</code><br> | |||
<code>quit;</code><br> | |||
<li>On Zabbix server host import initial schema and data. You will be prompted to enter your newly created password used when setting up the mysql database.</li> | |||
<code>zcat /usr/share/doc/zabbix-server-mysql*/create.sql.gz | mysql -uzabbix -p zabbix</code> | |||
<li>Edit the server configuration file ( ''/etc/zabbix/zabbix_server.conf'' ) to include the correct database password used when you setup the database above. ( ''DBPassword=<password>'' ) | |||
: [[File:DBPassword.png | 500px]] | |||
<li>Edit the server configuration file ( ''/etc/zabbix/apache.conf'' ) to include the correct timezone. [https://www.php.net/manual/en/timezones.php A list of valid PHP timezones can be found here.] We will be using ''America/Chicago''.</li> | |||
: [[File:Apache_timezone.png | 500px]] | |||
<li>Restart the server. Then set it to auto start on startup:</li> | |||
<code>systemctl restart zabbix-server zabbix-agent apache2</code><br> | |||
<code>systemctl enable zabbix-server zabbix-agent apache2</code> | |||
<li>Access the Zabbix web application at http://yourserver/zabbix/ and complete the setup wizard. [https://www.zabbix.com/documentation/5.0/manual/installation/frontend Detailed instructions for completing the setup wizard can be found here on the Zabbix site.]</li> | |||
<ul> At the end of the setup wizard you may need to download a ''zabbix.conf.php'' and save it to ''/etc/zabbix/zabbix.conf.php'' on your system.</ul> | |||
<li> Login to http://yourserver/zabbix/ (where yourserver is the IP address or DNS name for your system) with the username and password found [https://www.zabbix.com/documentation/5.0/manual/quickstart/login on the Zabbix site login instructions].</li> | |||
: [[File:Enable_monitoring_zabbix.png | 500px]] | |||
<ul>The default superuser credentials are user name '''Admin''' with password '''zabbix'''.</ul> | |||
<li> Enable monitoring of your Zabbix server host (''Configuration'' -> ''Hosts'')</li> | |||
: [[File:Enable_monitoring_zabbix.png | 500px]] | |||
: ''NOTE: [https://www.zabbix.com/documentation/5.0/manual The Zabbix manual] may be helpful in completing these monitoring setup tasks.'' | |||
* Add the templates to the host appropriate for the services we are running on the server (HTTP, IMAP, MySQL, SMTP, SSH) | |||
: [[File:Zabbix_templates.png | 500px]] | |||
* Explore some of the data available through Zabbix such as various graphs (''Monitoring'' -> ''Graphs''), Latest Data (''Monitoring'' -> ''Latest Data''), Screens (''Monitoring'' -> ''Screens''), and Events (''Monitoring'' -> ''Events'') | |||
* Try temporarily stopping some of the services on your system (to simulate a problem) such as the Postfix SMTP server, ''courier-imap'' server, etc. using the command line '''service''' command. | |||
* Re-check the data in Zabbix with the services turned off, are you alerted of the problems? Make sure to turn the services back on when you're done. | |||
: ''NOTE: Most services will not instantaneously show as down, the templates for the service probably check it once per minute or less so you may need to leave things down for a bit to see it in the Web UI.'' | |||
* If you have additional time see if you can get email notifications of failed services working (see ''Administration'' -> ''Media Types'' -> ''Email and Configuration'' -> ''Actions'') | |||
</ol> | |||
==Checking Your Work== | |||
<li> Automatically check your results by running this command:</li> | |||
<code><nowiki> | |||
curl https://raw.githubusercontent.com/mnjk-inver/Linux-2480-Rebuild/main/lab_12_test.py | python3 | |||
</nowiki></code> | |||
</ol> | |||
=Web App= | |||
You can check your progress on any of the labs in the ITC-2480 course from a webapp from this link: <br> | |||
[http://webcheck.itc2480.campus.ihitc.net webcheck.itc2480.campus.ihitc.net]<br> | |||
You must be logged into the campus VPN to use this application. | |||
Latest revision as of 16:10, 25 April 2021
Introduction
In this lab you will learn about several Linux utilities which can be used for monitoring Linux and other systems for security and service uptime purposes.
In this lab you will perform the following tasks:
You will be introduced to the following commands:
Lab Procedure
Prerequisites
- Open an SSH console to your Linux system using the PuTTY software, login with your standard user account
- The IP address of a partner's system which you have permission to portscan
Monitoring connections with netstat
Video Tutorial - Monitoring Connections with Netstat
One common activity you would want to do when evaluating the security of a system is to find out what ports the system is accepting connections on. For this reason most operating systems have some kind of utility to display active network connections and open ports, Linux is no exception. The netstat utility can show you currently active network connections as well as open ports on your local system. Take a look at the man page for the netstat command. Specifically, figure out what the -n -a -t -p and -u options do.
- Run the netstat command on your system and observe the output.
- Try to identify what the purpose of each open port on your system is. There are many online guides to common uses for ports.
- Use the sudo ps aux command (along with grep) to match the PID (process ID) numbers of open ports shown in netstat -natup with specific processes on your system.
- Connect to the IP address or domain name of your system through your web browser and re-run the netstat -natup command to see the TCP session established by your browser to download the website.
sudo netstat -natup
- You'll find that there are a number of ports open on your system. Some of these we have opened to provide a specific service such as SMTP, DNS, Webserver, etc. but some such as the sunrpc port are open simply by default on a fresh install. There are a number of different strategies you can use to secure your system including disabling a service, binding it to an internal-only IP address, or blocking access with a firewall rule. If your firewall is setup with an implicit (or explicit) reject any rule at the bottom of the input chain and you have not specifically opened a port it should not be accessible from other systems. How can we test that though? The netstat utility is useful at making a list of ports somehow open on the system but it does not show us how those ports react if someone outside actually tries to connect.
Scanning ports using nmap
Video Tutorial - Scanning Ports with nmap
The nmap Network Mapper utility is a very powerful security scanning utility available on Linux. While netstat uses information from the Linux kernel about what ports and connections are in use by what processes nmap actively probes and tests ports on your system or another system to determine whether the port is open or not as well as additional information about the port in some cases. Unlike netstat, nmap is not part of the default Debian installation so you will need to install the nmap package before proceeding. nmap is complex and powerful. Entire books and extensive documentation are available which you may want to reference but we'll only be exploring some of the more basic features in this introduction.
- NOTE: Before we begin this section of the lab it is important to remember that scanning a system is often seen as an attack against the system and should not be done unless you are the administrator of both the system that you are scanning from and the system you are scanning or have the explicit permission of the system administrator of those systems! In some areas people have been legally charged and prosecuted for scanning of systems which they are not authorized to do. You have been warned!
- Make sure nmap is installed
- nmap provides a system on the Internet which they allow you to scan for testing purposes so let's try a verbose scan which gives additional diagnostic detail.
- Review the output and then run the same command without the -v verbose option and compare the output you receive.
- The answer is related to how you have firewall rules setup and what addresses you have services bound to. For example by default on Debian systems the mySQL/MariaDB server daemon only listens for connections on the localhost address (127.0.0.1) and not on outside interfaces. Try running the nmap 127.0.0.1 command and then compare output with the nmap <your outside ip address here> command. Do you see some network services listening only on the localhost address. These services are not accessible from outside your computer even though the ports are open and you would see them as open with netstat. This shows us some of the additional value of using nmap.
- The most realistic use of nmap though is to scan like an attacker would using a system outside of the one you're testing. Use nmap to scan a partner's IP address in the class and take a look at some of the nmap documentation to try a few different types scans on that system. If you would like you can also try scanning the entire ITC-2480 subnet (172.17.50.0/24) if you want to try some subnet scanning capabilities.
- nmap also supports scanning IPv6 addresses. Note that a running service is not necessarily listening on both IPv4 and IPv6 addresses just because you have them both active on your machine. Figure out how to scan IPv6 addresses with nmap and try scanning both an IPv4 and IPv6 address of your machine and compare the results. Use the same type of address (i.e. both IPv4 and Ipv6 addresses should be the localhost addresses or should both be outside addresses) Are the same services open on both IPv4 and IPv6 on your system?
sudo apt install nmap
nmap -v scanme.nmap.org
- When scanning your own system there are a few different ways to go about it. You could either scan the localhost address 127.0.0.1 or the actual outside IP address of your system. You could also setup a separate system or VM and do the scanning from that system. In each case you might see somewhat different results, can you guess why?
- Remember that in our case these systems are secure from the outside world because we have an upstream firewall which you have bypassed by connecting to our VPN and these systems are using unroutable private IPv4 addresses.
Monitoring Services and Graphing System Statistics with Zabbix
Video Tutorial - Monitoring with Zabbix
In this section we will be following the instruction on how to install zabbix using these instructions on the Zabbix site.
- Go to the instructions link above and scroll down to part 2. Start by installing the zabbix repository.
- Install Zabbix server, frontend, agent
- Create a database, a user, and schema following the instructions on the same website.
- NOTE: These instructions use the MySQL/MariaDB command line, if you prefer you can create the same database, user, and schema using the Webmin software but you'll have to translate the command line instructions into the actions required in Webmin.
mysql -uroot -p
create database zabbix character set utf8 collate utf8_bin;
create user zabbix@localhost identified by 'password';
- Replace password with a password you want to use. (Command needs the quotes so don't remove them).
grant all privileges on zabbix.* to zabbix@localhost;
quit;
- On Zabbix server host import initial schema and data. You will be prompted to enter your newly created password used when setting up the mysql database.
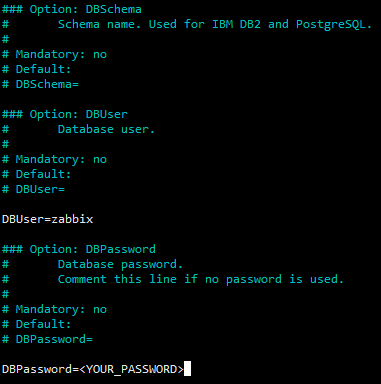
- Edit the server configuration file ( /etc/zabbix/zabbix_server.conf ) to include the correct database password used when you setup the database above. ( DBPassword=<password> )
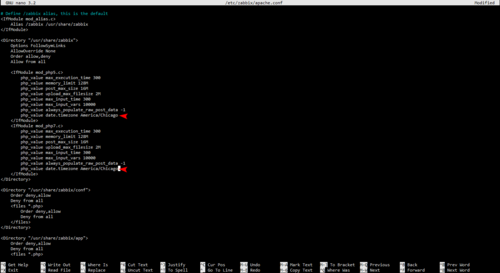
- Edit the server configuration file ( /etc/zabbix/apache.conf ) to include the correct timezone. A list of valid PHP timezones can be found here. We will be using America/Chicago.
- Restart the server. Then set it to auto start on startup:
- Access the Zabbix web application at http://yourserver/zabbix/ and complete the setup wizard. Detailed instructions for completing the setup wizard can be found here on the Zabbix site.
- Login to http://yourserver/zabbix/ (where yourserver is the IP address or DNS name for your system) with the username and password found on the Zabbix site login instructions.
- Enable monitoring of your Zabbix server host (Configuration -> Hosts)

- NOTE: The Zabbix manual may be helpful in completing these monitoring setup tasks.
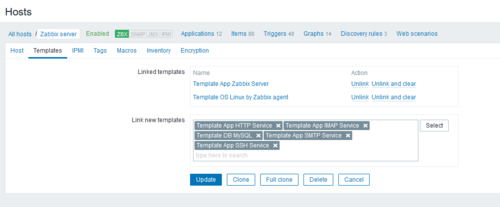
- Add the templates to the host appropriate for the services we are running on the server (HTTP, IMAP, MySQL, SMTP, SSH)
- Explore some of the data available through Zabbix such as various graphs (Monitoring -> Graphs), Latest Data (Monitoring -> Latest Data), Screens (Monitoring -> Screens), and Events (Monitoring -> Events)
- Try temporarily stopping some of the services on your system (to simulate a problem) such as the Postfix SMTP server, courier-imap server, etc. using the command line service command.
- Re-check the data in Zabbix with the services turned off, are you alerted of the problems? Make sure to turn the services back on when you're done.
- NOTE: Most services will not instantaneously show as down, the templates for the service probably check it once per minute or less so you may need to leave things down for a bit to see it in the Web UI.
- If you have additional time see if you can get email notifications of failed services working (see Administration -> Media Types -> Email and Configuration -> Actions)
wget https://repo.zabbix.com/zabbix/5.0/debian/pool/main/z/zabbix-release/zabbix-release_5.0-1+buster_all.debdpkg -i zabbix-release_5.0-1+buster_all.debapt update
apt install zabbix-server-mysql zabbix-frontend-php zabbix-agent
zcat /usr/share/doc/zabbix-server-mysql*/create.sql.gz | mysql -uzabbix -p zabbix
systemctl restart zabbix-server zabbix-agent apache2systemctl enable zabbix-server zabbix-agent apache2
- At the end of the setup wizard you may need to download a zabbix.conf.php and save it to /etc/zabbix/zabbix.conf.php on your system.
- The default superuser credentials are user name Admin with password zabbix.
Checking Your Work
curl https://raw.githubusercontent.com/mnjk-inver/Linux-2480-Rebuild/main/lab_12_test.py | python3
Web App
You can check your progress on any of the labs in the ITC-2480 course from a webapp from this link:
webcheck.itc2480.campus.ihitc.net
You must be logged into the campus VPN to use this application.


