Cacti: Difference between revisions
Jump to navigation
Jump to search
(Undo revision 3229 by Ciscodude4life (Talk)) |
|||
| (12 intermediate revisions by 2 users not shown) | |||
| Line 1: | Line 1: | ||
[[File:Cactimac.JPG|middle]] | |||
== Cacti == | == Cacti == | ||
Cacti is graphical representation of network traffic over a device. It can be used to monitor network traffic over individual ports to | Cacti is graphical representation of network traffic over a device. It can be used to monitor network traffic over individual ports to all together usage. It can be installed in the windows enviroment or you may install it on a Unix-Linux based OS. Cacti can be found at [http://www.cacti.net Cacti.net] and also more information provided. | ||
== Installation == | == Installation == | ||
| Line 6: | Line 7: | ||
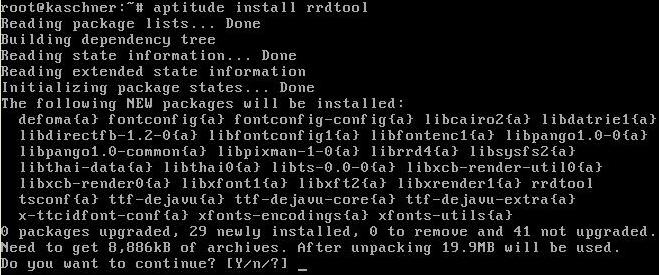
*Step 1. You will need to install three dependicies for cacti you will need RRdTool, Apache2, MySQL with apt-get or aptitude. | *Step 1. You will need to install three dependicies for cacti you will need RRdTool, Apache2, MySQL with apt-get or aptitude. | ||
[[File:Install_rrdtool.JPG]] | [[File:Install_rrdtool.JPG]] | ||
* | [[File:installrrd.JPG]] | ||
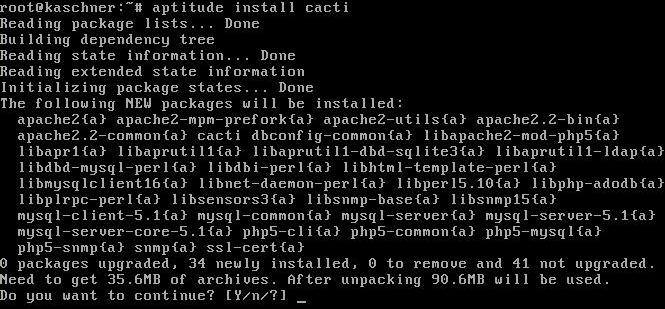
*Step 2. Install Cacti using apt-get or aptitude. | |||
[[File:icacti2.JPG]] | |||
*Step 3. Go into the Apache2 folder and change the configuration file /etc/apache2/apache.conf with nano or any text editor. At the end of the file add the line: Include /etc/cacti/apache.conf | |||
[[File:Apacheconf.JPG]] | |||
*Step 4. In the crontab you will need to create a new task. You can edit this by: nano /etc/crontab . In here you will add a task by putting in this line: * /5 * * * * Root /www/php/bin/php /www/htdocs/cacti/poller.php > /dev/null 2>&1 | |||
[[File:crontab.JPG]] | |||
*Step 5. On the switch you will have to enter these basic commands. You can add more like an access list but this is just the basics. First you will need to configure the Vlan you will be operating on. Then you will need to be in configure terminal. Enter logging trap debug. Then enter logging (ip address of cacti). Then enter snmp-server community (Community Name) ro. Now your switch should be set. | |||
[[File:switchcmd.JPG]] | |||
== Usage == | |||
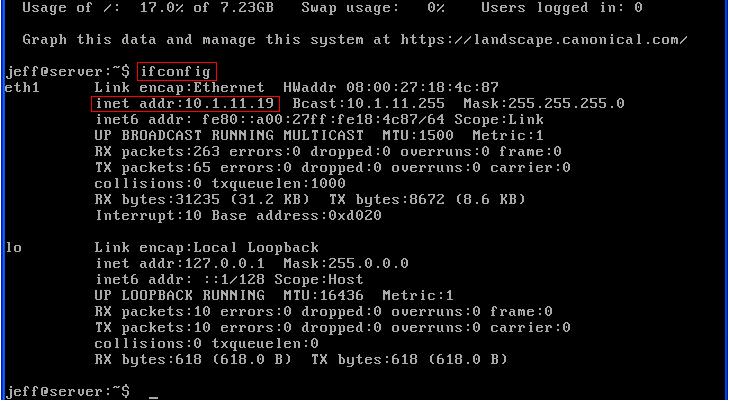
*To use cacti you will first need to know where it is on your network. To get the cacti server's IP address in the Linux server type ifconfig. | |||
[[File:ifconfig.JPG]] | |||
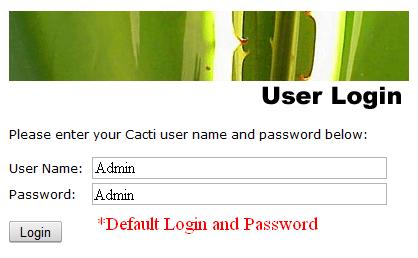
*Now you will be prompted to login. The default login is admin/admin. | |||
[[File:login2.JPG]] | |||
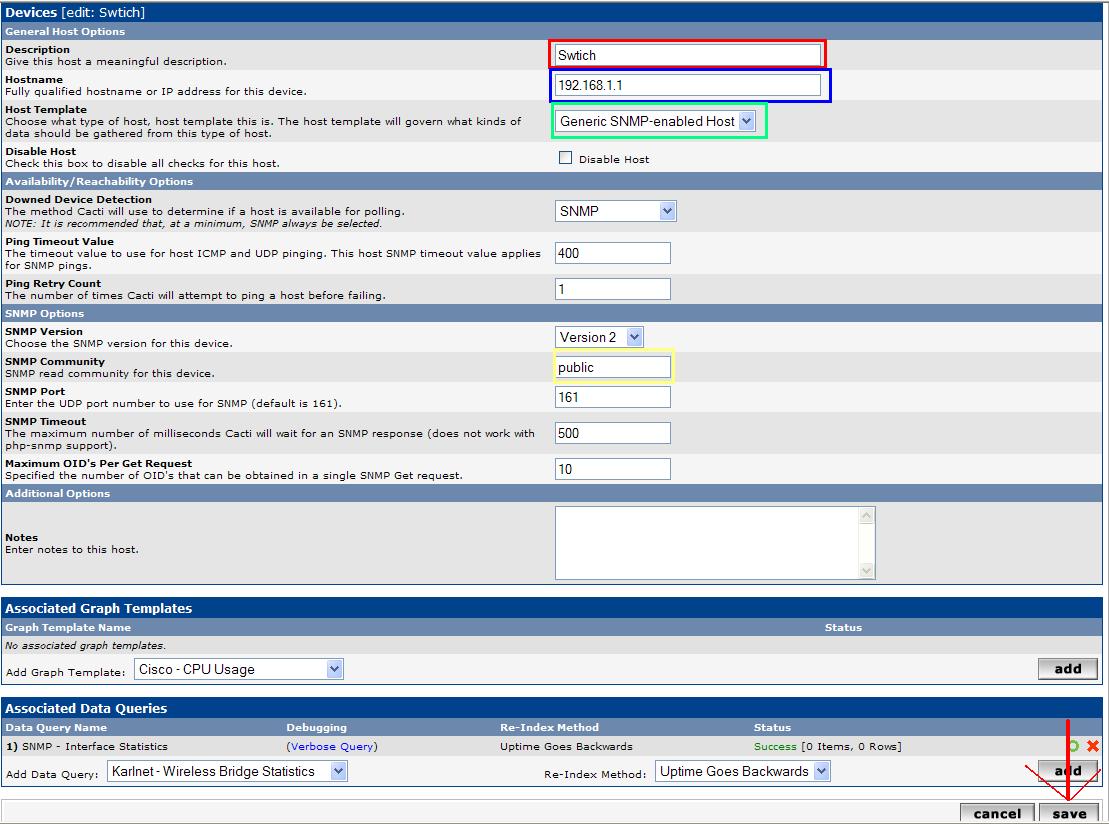
*To configure the devices over on the left side if you are on the console tab there will be a link that is called devices. On this page you will have to set the name for the device. The device's IP address. The Host Template which is the type of device you are going to monitor. The SNMP community is group name you gave to the SNMP permissions on the device. Then click save. | |||
[[File:devices.JPG]] | |||
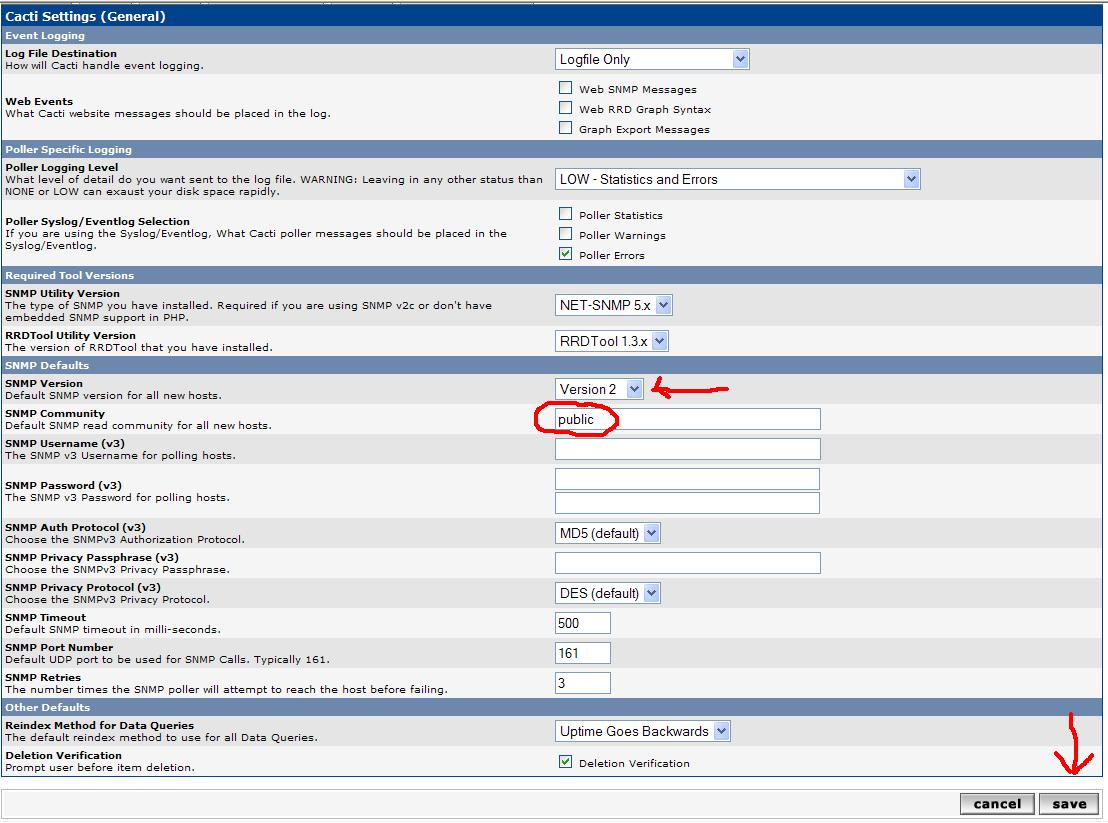
*To change the settings for cacti click the settings link on the left side menu of the console tab. You will need to change the SNMP version you are using on the devices. The SNMP community is the group you assigned the SNMP logging to on the device. | |||
[[File:settings.JPG]] | |||
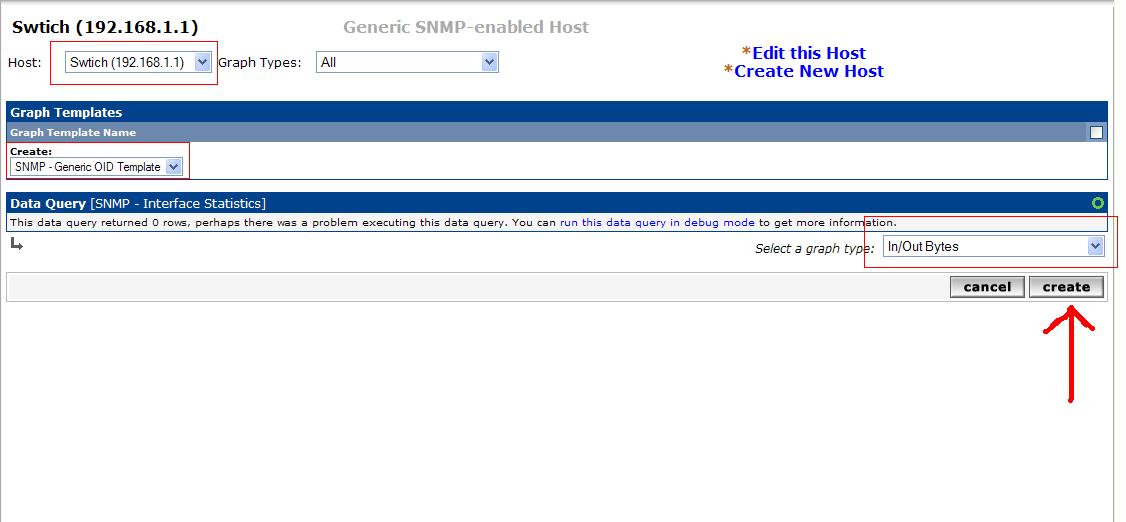
*To create the graphs you will need to go New Graphs on the left menu on the console tab. This is pretty much up to you and how you want it to show and look for. | |||
[[File:creategraph.JPG]] | |||
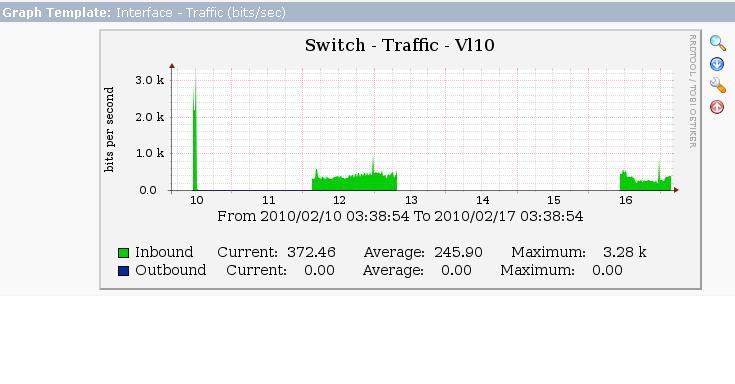
*Here is a picture of our attempt to view traffic on the room switch, but the laptop we used was a school one and kept crashing so thats the reason for low activity spots. | |||
[[File:Graph1.JPG]] | |||
Latest revision as of 20:35, 1 September 2010
Cacti
Cacti is graphical representation of network traffic over a device. It can be used to monitor network traffic over individual ports to all together usage. It can be installed in the windows enviroment or you may install it on a Unix-Linux based OS. Cacti can be found at Cacti.net and also more information provided.
Installation
For this installation we will be installing cacti on a Ubuntu virtual box system.
- Step 1. You will need to install three dependicies for cacti you will need RRdTool, Apache2, MySQL with apt-get or aptitude.
- Step 2. Install Cacti using apt-get or aptitude.
- Step 3. Go into the Apache2 folder and change the configuration file /etc/apache2/apache.conf with nano or any text editor. At the end of the file add the line: Include /etc/cacti/apache.conf
- Step 4. In the crontab you will need to create a new task. You can edit this by: nano /etc/crontab . In here you will add a task by putting in this line: * /5 * * * * Root /www/php/bin/php /www/htdocs/cacti/poller.php > /dev/null 2>&1
- Step 5. On the switch you will have to enter these basic commands. You can add more like an access list but this is just the basics. First you will need to configure the Vlan you will be operating on. Then you will need to be in configure terminal. Enter logging trap debug. Then enter logging (ip address of cacti). Then enter snmp-server community (Community Name) ro. Now your switch should be set.
Usage
- To use cacti you will first need to know where it is on your network. To get the cacti server's IP address in the Linux server type ifconfig.
- Now you will be prompted to login. The default login is admin/admin.
- To configure the devices over on the left side if you are on the console tab there will be a link that is called devices. On this page you will have to set the name for the device. The device's IP address. The Host Template which is the type of device you are going to monitor. The SNMP community is group name you gave to the SNMP permissions on the device. Then click save.
- To change the settings for cacti click the settings link on the left side menu of the console tab. You will need to change the SNMP version you are using on the devices. The SNMP community is the group you assigned the SNMP logging to on the device.
- To create the graphs you will need to go New Graphs on the left menu on the console tab. This is pretty much up to you and how you want it to show and look for.
- Here is a picture of our attempt to view traffic on the room switch, but the laptop we used was a school one and kept crashing so thats the reason for low activity spots.

